Adventures in Optimization: Threading
After identifying the superficial bugs slowing GC4, I set out to measure the degree of parallelism I was able to achieve with the new multi-threaded calculation code. Are there any other calls like GetWRefCon unintentially introducing dependencies stalling threads? Was GC able to keep multiple CPU cores fed wih independent work? In additional to the traditional questions of Where is the software spending its time? What is it doing there? I now have to ask those question separately of multiple threads of execution on multiple CPU cores and understand the answers in context, asking When is one thread of execution stalled waiting for results from another? With the right tool, the answer can be obvious.
Here in Apple Thread Viewer, the top eight rows represent threads running preemptively evaluating functions to plot a graph. The bottom row represents the main application thread which processes user events, creates the preemptive threads, asks periodically if they are done yet, collects their results, draws them, and tells them when to start on the next frame. The illustrates a simple flaw in the architecture. The main thread does not initiate parallel computation on the next frame until after it is done drawing the previous frame. The preemptive threads are thus blocked until drawing is complete. There is no need for this. It is simply a holdover from the 1993 design when drawing was very much faster than computation. Drawing is still faster than calculation, but not so much so that it can be ignored.
The Thread Viewer image above shows GC4 graphing an animating 2D inequality: 0.5=(cos((x+n))+cos((y*sin(π/5)+x*cos(π/5)))+cos((y*sin((2*π/5))+x*cos((2*π/5))))+cos((y*sin((3*π/5))+x*cos((3*π/5))))+cos((y*sin((4*π/5))+x*cos((4*π/5))))). That calculation is embarrassingly parallelizable. Data decomposition into horizontal strips of the graph paper give each core a separate problem to work on with no dependencies to add communication overhead.
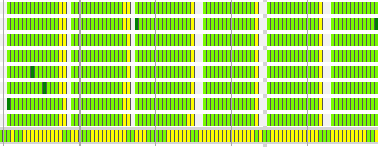
The thread profile below illustrates GC4 animating the implicit 3D surface: x2 + y2 + z2 + sin(nx) + sin(ny) + sin(nz) = 1. It tells a different story.

The top level periodic structure is clear, showing five frames of the animation. The top eight rows, again, are preemptive threads performing the numeric computations constructing the 3D model. The second to bottom row is the main application thread which processes user events, creates the preemptive threads, asks periodically if they are done yet, collects their results, submits them to OpenGL to draw them, and tells them when to start on the next frame. The bottom row is the thread which Mac OS X dedicates to multi-threaded OpenGL.
Again, we see that computing the next frame is blocked until drawing is done. The fine lines in the main thread show it polling, asking periodically if the calculations are done yet. When they are all done it begins collecting the results and submitting them to the OpenGL pipeline. When that is done, OpenGL begins drawing. Calculation on the next frame does not begin until the previous frame is fully drawn and all its data structures released.
Furthermore, the CPU cores are not at all fully utilized. Although there are eight cores and eight compute threads, the data decomposition for implicit 3D surface equations does not create an equal workload for each thread. Some threads finish much sooner and are then idle until the next frame. Upon closer examination, it is clear that in each animation frame, the compute thread with the most work, which finished last, is the bottleneck holding everything else idle until it is done.
The next image shows the same equation, but with the data decomposed into 16 jobs rather than 8. There are still only 8 compute threads and only 8 CPU cores. Now, however, there are more jobs in the work queue which feeds those threads, so the first 8 jobs which finish will grab another job from the queue and keep working.

Here is a trace showing the same work done by 32 jobs. The 3D implicit surface solver is not quite as embarrassingly parallel as the 2D inequality grapher. It takes more work to set up each parallel compute thread, and takes more effort to combine the results at the end. While there cores are less frequently starved for work with more jobs, the total amount of work done is higher.

The rows in these pictures represent threads of execution which are things the software is doing in parallel. The color coding identifies the particular CPU core running each thread. This machine has 8 cores running, in this picture, ten threads. Only 8 can be active at any one time (and sometimes fewer, as there are other things happening on this computer not illustrated here). The Mac OS X scheduler decides which threads run on which cores. While it tries to keep each thread on the same core, sometimes a thread of execution will hop from one core to another. That can be expensive. The more threads the scheduler is running, the more difficult it is to keep threads from hopping around.
Zooming in on these pictures provide additional clues. They show the specific calls in the source code where one thread is paused awaiting use of a shared resource. (new and delete are thread-safe, but rely on shared state. If called at the same time from multiple threads, all but one thread will pause so that memory management is handled safely, sequentially. As long as they are not called too frequently, this is not a problem. I was calling them too frequently, but increasing the block size on my collection class fixed that.) They show which OpenGL calls drain the OpenGL pipeline (unintentionally) synchronizing the multi-threaded OpenGL rendering to the application thread OpenGL command buffering. (glGenBuffers, glDeleteBuffers, aglEnable, and aglError all drain the pipeline before proceeding.) They show what where the time is being spent after the drawing but before the new calculations begin. (Releasing OpenGL vertex buffer objects from the last frame showed up as expensive memory management delaying the next frame. There's no fundamental reason the parallel computation threads can't be started before that tear down happens in the main thread.)