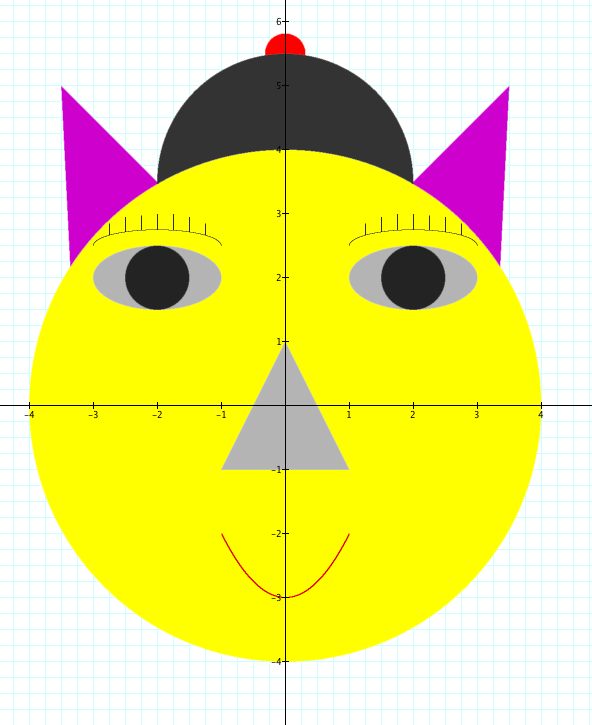
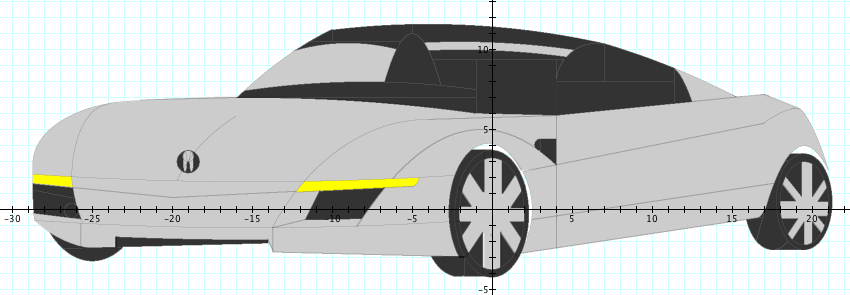
(Click the image to see the equations.)
Submitted by Anh Nguyen.
]]>Since we know that the progress and prosperity of future generations will depend on what we do now to educate the next generation, today I'm announcing a renewed commitment to education in mathematics and science. This is something I care deeply about....
A half century ago, this nation made a commitment to lead the world in scientific and technological innovation; to invest in education, in research, in engineering; to set a goal of reaching space and engaging every citizen in that historic mission. That was the high water mark of America's investment in research and development....
We will not just meet, but we will exceed the level achieved at the height of the space race, through policies that invest in basic and applied research, create new incentives for private innovation, promote breakthroughs in energy and medicine, and improve education in math and science.
Obama, speaking before the National Academy of Sciences today, inspires. Read or listen to the full speech here: text, audio.]]>(Click the image to see the equations.)
Submitted by Anh Nguyen.
]]>Why, you ask? John Scalzi says it best:
Chad is, like, six feet, 28,000 inches. He’s a pretty big dude. And as everyone knows, large dudes are funny to watch dancing. But there’s more! He’s also a physicist and a fully tenured professor or such, and as well all know, the overlap between “tenured physics professors” and “adept dancers” is trivially small. Finally, Chad has a sort of gawky, innate dignity — he’s a friendly sort, but let’s just say I’ve never seen him prone to wanton acts of physical comedy. What I’m saying is, making Chad Orzel dance like a monkey would be the comedy highlight of 2008.]]>
(Click the image to see the equations.)
]]>
CyberMath is a shared virtual environment for exploring mathematics. I've long wanted to make Graphing Calculator into an authoring tool for such an interactive immersive space. The popularity and success of World of Warcraft hints at the possibilities in coming years.
Does anyone here use Second Life or have any knowledge of Croquet? The technology for building these spaces is maturing. I'm now wondering how to make it accessible to teachers and curriculum authors so that they can focus on the mathematical content and pedagogy while constructing mathematical landscapes.
I would welcome any advice.
]]>


Kudos to Astropixie for pointing out the images!
]]>Thank you, Nico!
Click the image to see the equations.
Click here for the movie.]]>Anyone who's been around children (or been a child themselves) knows about the "why?" game. It starts out with something like this: "Daddy (or Mommy), why is the sky blue?" So you explain about Rayleigh scattering and the fact that molecules in the atmosphere scatter photons with an efficiency that's inversely proportional to the fourth power of the wavelength. You are hardly finished when the next question shoots across your bow: Daddy (or Mommy) why is there an atmosphere?" So you dutifully explain planetary evolution, the expulsion of vast quantities of carbon dioxide that facilitated the evolution of life forms that exploit photosynthesis, producing oxygen, etc. Then the third question comes "Daddy (or Mommy) why do planets form?" You follow this question with a short lecture on the planetary nebular hypothesis. But the questions don't stop; they just keep coming and coming and coming.I want to live in that world: where one just presumes that, of course when any child asks about the blue sky, their parent will dutifully explain Rayleigh scattering and planetary evolution!
Props to Tara C. Smith for reviewing Danica McKellar's new book, "Math Doesn't Suck" and interviewing the author.
I'd like to show girls that math is accessible and relevant, and even a little glamorous! This society constantly bombards us with damaging social messages telling young girls that math and science aren't for them. I want to show them that yes, math is for them, and my goal was to write an entertaining book that presents math in a fun teen-magazine style, to keep this subject in as non-intimidating and non-stuffy an environment as possible.While on the theme, check out an old Rebecca Eisenberg column, Girls Need Math.
I want to see girls embrace math who never thought they could, and for them to understand the importance of developing a strong mind. Math is a fabulous mind strengthener - it's like going to the gym, for your brain! Most of all, I'm hoping to help girls strengthen their fortitude and feelings of self-esteem through finding the courage to tackle the often-challenging subject of mathematics. I want them to feel empowered; if they can do math, they can do anything!
That's why it comes back to math. Math has no bias. It doesn't come from TV. It doesn't know what you're wearing. Math treats all people equally. Especially when you're in a hard class with all boys, when nobody's cheering you on from the sidelines, when it's not "cool" to be smart, math is a nice thing to have. When nothing else makes sense, math reaches an answer.]]>
Now that I have my Mac back, I can launch Windows in the background under VMWare and mix Windows XP windows on my Mac OS X desktop. It's peculiar seeing the Microsoft Visual Studio project window next to the XCode project window next to the CodeWarrior project window. I've resisted the tempation to install Codewarrior for Windows just to complete the set. I can now build Graphing Calculator on Windows and run the Windows release in a window on my Macintosh next to the Mac OS X release to compare bugs.
It's not nearly as nice as during Graphing Calculator 3.2 development, however, when CodeWarrior on Mac OS Classic could "Build All" to compile both the Mac OS and Windows binaries under the same IDE. I expect debugging to be easier, however. Back then, I ran the Windows build under Virtual PC, but VPC was too slow to run the CW IDE and debugger and on a single-processor machine I couldn't convince CodeWarrior's two-machine debugging facility to work on a single computer with the other "machine" being faked by Virtual PC. It hit a deadlock condition starving one process of time while also waiting for it to respond.
]]>
ImplicitAnimation.gcf animates x2 + y2 + z2 + sin(nx) + sin(ny) + sin(nz) = 1.
ConcentricSpheresTest.gcf animates cos(n*sqrt(x2 + y2 + z2)=0.
For a baseline, timing each animation using Graphing Calculator's software renderer using a single CPU core, gives 8.4s and 19s, respectively. The Shark profile looks like this, with most of the time spent calculating the equation, and more time rendering ConcentricSpheresTest.
Switching to (single-threaded) OpenGL rendering, the timings become 7.7s and 25s. ConcentricSpheresTest actually slows down. The profiles show that two cores are now active in parallel as OpenGL renders the scene in the main thread while the WorkQueueConsumer prepares the next frame. Zooming into those pictures shows the main thread spending all of its time in OurSubmitTriangles/glDrawElements. In the second case, the overhead of submitting a huge number of tiny triangles to the GPU, (most of them occluded anyway), makes the animation slower despite the hardware accelerated rendering. However, this is already faster than GC 3.5, in which all computations were done in the main thread along with all rendering, cooperatively multi-tasked. Using even a single preemptive thread for calculations allows them to run independently in parallel with drawing and processing user UI events, as seen above.
After breaking the numeric part of the work into jobs which can be run in parallel, the timings become 2.2s and 12s. The profiles now show a pronounced difference in character. The rendering time dominates the second case. The first case looks like the compute and rendering loads are similar. (Important note: the scale on each profile image is different. Comparisons are meaningful only within a single image. Shark, unfortunately, does not provide a time "Scale Bar" on these views. Is anyone on the Shark team reading?)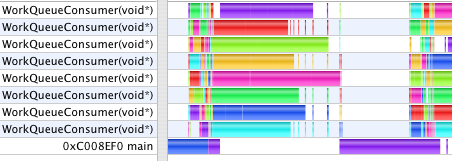
In both cases, still, drawing serializes the work. While one CPU core executing the main thread draws, all the other cores go idle waiting for the next thing to start.
Using vertex buffer objects changes the animation timing to 2.1s and 12s. With VBOs enabled in Graphing Calculator, rendering is a two-step process where first, the arrays of vertex and normal vectors, triangles, and colors are submitted with a hint to cache them in VRAM. The command to draw then needs submit only a reference to these buffers. When spinning a static model, this is can be an enormous win, as all the data can stay in VRAM to which the GPU has fast access, and only a new rotation matrix need be sent each frame over the relatively slow connection between GPU and CPU. In these tests, however, we are animating a still model which changes the vertex data each frame.
Enabling multi-threaded OpenGL is easy, but that is just the first step. Any glGet calls drain the MTGL pipeline and synchronize execution, eliminating the benefits of parallelism. Communication between parallel threads of execution is very difficult to get right. What it means for one thread to ask another thread about the (changing) OpenGL state when the relative order of operations between threads can vary is tricky, so the simplest approach to ensure correctness is to make all the communication one-way. After avoiding calls to glGetError, glGenBuffer, and other state queries, Shark still showed the GC main thread stalling at gleFinishCommandBuffer waiting for MTGL to drain in numerous circumstances. glDeleteBuffer was a spike in the profile. On mac-opengl, Richard Schreyer advised: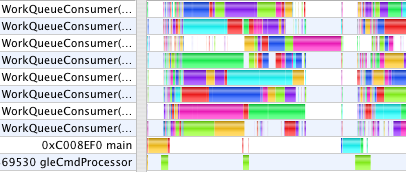
Unfortunately, the implementation of glDeleteBuffers (and all other glDelete*) still blocks in all cases right now. Your best workaround is to not delete the buffer object, but instead call glBufferData(size=0) to free the storage. You'll also need keep track of the used/free buffer object names yourself (I assume you're already doing this to avoid paying the same cost when calling glGen*). Textures can be handled in the same way (width=0, height=0, depth=0).
These profiles now show a new thread, gleCmdProcessor. Graphing Calculator makes all of its OpenGL calls from the main thread. With single-threaded OpenGL, all the CPU work done by the OpenGL driver also occurs in the application main thread. With multi-threaded OpenGL, GC's OpenGL calls made in main are queued into a command buffer which the gleCmdProcessor thread works through talking to the GPU. In the first case above, gleCmdProcessor has relatively little work to do. In the second case, it dominates the profile, and still blocks the WorkQueueConsumer threads from continuing on to the next step.
The problem is still that although GC can submit jobs to distribute the numeric work across all CPU cores, GC tries to render the last frame before submitting the jobs for the next frame. This serializes the work leaving cores idle while one is working alone on the rendering. Although MTGL can work in parallel, GC still must call glBufferData from the main thread to submit the model data, and that takes time.
When GC finishes the numeric computation for one step, it saves those results away to prepare for starting the next step. Only after the slider has been advanced and the next calculations begun does the main thread then submit those saved results to OpenGL to render. The animation times are now 1.8s and 6.7s. Now, the work done in main and gleCmdProcessor overlap the numeric work done on jobs in the WorkQueue. The remaining areas in the first profile where the Work Queue threads are starved is due to the uneven complexity of the jobs the way GC chooses its data decomposition to parallelize the calculation. While creating more, smaller jobs would even out the work load, that also increases overhead and duplication of effort. In the second profile, the stall occurs because we only double-buffer the model data. The numeric computation gets one frame ahead, then waits while the main thread uses glMapBuffer to submit the last frame's model before it can save the newly computed model so that it can begin the next frame's calculation. We could use a circular buffer to get several frames ahead, but as we shall see in a moment, that ultimately won't help.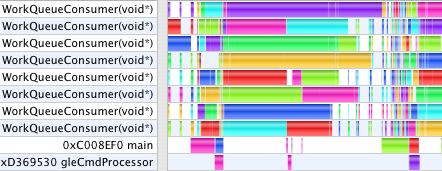
With this last step the GC user interface becomes unresponsive as MTGL can have commands for several seconds worth of frames buffered, and there is no way to kill them, or even to measure how many commands are buffered. This behavior occurs in the second case where the workload is dominated by rendering, but not in the first which is compute-bound evaluating functions. When moving a graph with the mouse, or even stopping an animation, one first sees up to several seconds of backlogged frames rendered before the 3D graph registers any feedback. To make GC responsive, glFlush is inserted into the draw loop each frame to intentionally block and drain the MTGL command buffer so it doesn't get more than a frame ahead. After this, the final timings for today are 1.8s and 8.9s.
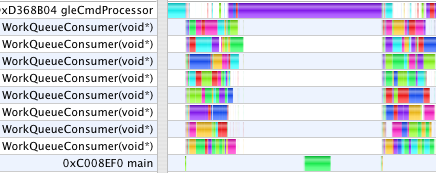
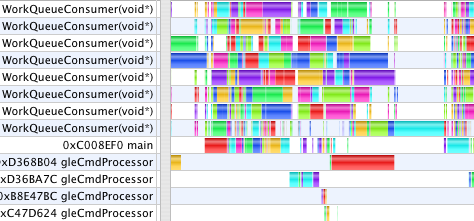
This profile shows GC running with three windows open, one of which has two OpenGL contexts (to illustrate a coordinate transformation with side by side views). Each context gets its very own gleCmdProcessor thread in multi-threaded OpenGL. However, as I have only one video card, they all must take turns talking to the same GPU to drain their command buffers. We also see here, that regardless of how many windows or equations GC is drawing, it creates (on this machine) 8 WorkQueueConsumer threads to process the jobs constructed by all windows. While one can create as many threads in software as one likes, the threads run on physical CPU cores. When there are more threads running that cores to run them, the scheduler must swap threads in and out to give them all time, increasing overhead. GC uses threads for two categories of work: to parallelize expensive operations across multiple CPU cores, and to improve user interface response time by avoiding any potentially lengthy tasks in the main thread which processes all user events. Multi-threaded OpenGL aids enormously in the latter respect, keeping the main UI thread responsive, even in cases where MTGL does not otherwise speed up the actual rendering time.
Next installment: Computed textures, color arrays and fragment programs
]]>
The Thread Viewer image above shows GC4 graphing an animating 2D inequality: 0.5=(cos((x+n))+cos((y*sin(π/5)+x*cos(π/5)))+cos((y*sin((2*π/5))+x*cos((2*π/5))))+cos((y*sin((3*π/5))+x*cos((3*π/5))))+cos((y*sin((4*π/5))+x*cos((4*π/5))))). That calculation is embarrassingly parallelizable. Data decomposition into horizontal strips of the graph paper give each core a separate problem to work on with no dependencies to add communication overhead.
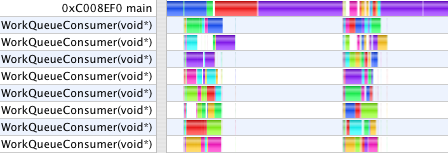
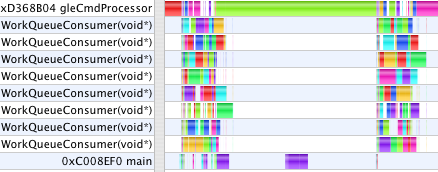
The thread profile below illustrates GC4 animating the implicit 3D surface: x2 + y2 + z2 + sin(nx) + sin(ny) + sin(nz) = 1. It tells a different story.
The top level periodic structure is clear, showing five frames of the animation. The top eight rows, again, are preemptive threads performing the numeric computations constructing the 3D model. The second to bottom row is the main application thread which processes user events, creates the preemptive threads, asks periodically if they are done yet, collects their results, submits them to OpenGL to draw them, and tells them when to start on the next frame. The bottom row is the thread which Mac OS X dedicates to multi-threaded OpenGL.
Again, we see that computing the next frame is blocked until drawing is done. The fine lines in the main thread show it polling, asking periodically if the calculations are done yet. When they are all done it begins collecting the results and submitting them to the OpenGL pipeline. When that is done, OpenGL begins drawing. Calculation on the next frame does not begin until the previous frame is fully drawn and all its data structures released.
Furthermore, the CPU cores are not at all fully utilized. Although there are eight cores and eight compute threads, the data decomposition for implicit 3D surface equations does not create an equal workload for each thread. Some threads finish much sooner and are then idle until the next frame. Upon closer examination, it is clear that in each animation frame, the compute thread with the most work, which finished last, is the bottleneck holding everything else idle until it is done.
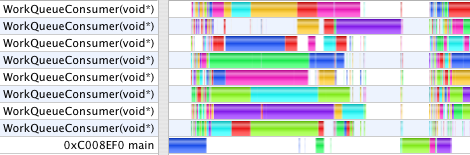
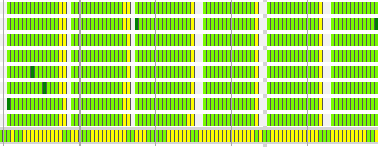
The next image shows the same equation, but with the data decomposed into 16 jobs rather than 8. There are still only 8 compute threads and only 8 CPU cores. Now, however, there are more jobs in the work queue which feeds those threads, so the first 8 jobs which finish will grab another job from the queue and keep working.
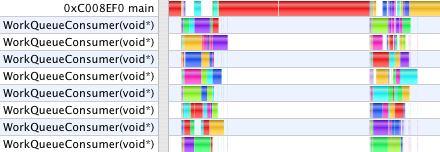
Here is a trace showing the same work done by 32 jobs. The 3D implicit surface solver is not quite as embarrassingly parallel as the 2D inequality grapher. It takes more work to set up each parallel compute thread, and takes more effort to combine the results at the end. While there cores are less frequently starved for work with more jobs, the total amount of work done is higher.
The rows in these pictures represent threads of execution which are things the software is doing in parallel. The color coding identifies the particular CPU core running each thread. This machine has 8 cores running, in this picture, ten threads. Only 8 can be active at any one time (and sometimes fewer, as there are other things happening on this computer not illustrated here). The Mac OS X scheduler decides which threads run on which cores. While it tries to keep each thread on the same core, sometimes a thread of execution will hop from one core to another. That can be expensive. The more threads the scheduler is running, the more difficult it is to keep threads from hopping around.
Zooming in on these pictures provide additional clues. They show the specific calls in the source code where one thread is paused awaiting use of a shared resource. (new and delete are thread-safe, but rely on shared state. If called at the same time from multiple threads, all but one thread will pause so that memory management is handled safely, sequentially. As long as they are not called too frequently, this is not a problem. I was calling them too frequently, but increasing the block size on my collection class fixed that.) They show which OpenGL calls drain the OpenGL pipeline (unintentionally) synchronizing the multi-threaded OpenGL rendering to the application thread OpenGL command buffering. (glGenBuffers, glDeleteBuffers, aglEnable, and aglError all drain the pipeline before proceeding.) They show what where the time is being spent after the drawing but before the new calculations begin. (Releasing OpenGL vertex buffer objects from the last frame showed up as expensive memory management delaying the next frame. There's no fundamental reason the parallel computation threads can't be started before that tear down happens in the main thread.)
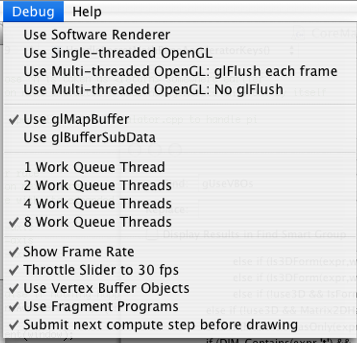
]]>For Graphing Calculator, I use performance measurements to make programming choices when comparing high-level algorithms, low-level implementation details, different compilers, and compilation options. Holding the Command key while pressing the slider Play button will initiate a stopwatch to time the slider. When I'm focusing on a particular routine, this is useful to compare small code changes from one build to the next. In the Graphing Calculator menu, the Graphing Calculator > Benchmark command runs through thirty-two tests timing calculation and drawing. These help me compare how GC behaves on different hardware and how its behavior changes across versions years apart. The report looks like this:
]]> Graphing Calculator 4.0d6 benchmark test at Wed Jun 6 11:50:33 2007 Graph pane is 500 x 500 pixels. Timer resolution: 6.5703e-05 seconds. Point 200 steps 7.63 seconds Arrow 200 steps 7.60 seconds Function 200 steps 9.36 seconds Complex-valued function 200 steps 13.10 seconds Parametric curve 200 steps 13.47 seconds Complex-valued parametric curve 200 steps 13.74 seconds Contour plot 200 steps 14.69 seconds Inequality 20 steps 1.84 seconds Complex-valued inequality 20 steps 2.18 seconds Differential equation 20 steps 3.73 seconds Color plot 20 steps 2.49 seconds Density plot 20 steps 2.19 seconds Complex-valued density plot 20 steps 2.54 seconds Coordinate transformation 20 steps 4.57 seconds Inverse coordinate transform 20 steps 5.36 seconds Point 200 steps 5.5 seconds 97.4 frames/s Vector 200 steps 6.4 seconds 98.9 frames/s Parametric curve 200 steps 5.97 seconds 99.3 frames/s Surface 200 steps 6.11 seconds 99.1 frames/s 1206640 triangles/s Surface (checkerboard) 200 steps 6.47 seconds 97.2 frames/s 1182449 triangles/s Surface (texture) 200 steps 6.34 seconds 99.3 frames/s 1207881 triangles/s Surface (lo-res) 200 steps 5.54 seconds 98.8 frames/s 3359 triangles/s Surface (lo-res, checkerboard) 200 steps 5.12 seconds 99.5 frames/s 3382 triangles/s Color animation 200 steps 6.38 seconds 99.2 frames/s 4222201 triangles/s Concentric spheres 200 steps 51.85 seconds 2.7 frames/s 1974451 triangles/s Landscape 50 steps 1.74 seconds 99.2 frames/s 1206798 triangles/s Implicit 50 steps 2.64 seconds 98.7 frames/s 5018935 triangles/s Surface (transparent) 50 steps 3.17 seconds 33.5 frames/s 407963 triangles/s Surface (transparent,lo-res) 50 steps 1.53 seconds 30.1 frames/s 1021 triangles/s Landscape (transparent) 50 steps 3.21 seconds 30.1 frames/s 366715 triangles/s Implicit (transparent) 50 steps 5.62 seconds 19.8 frames/s 1008924 triangles/s Concentric transparent spheres 1 steps 0.45 seconds 9.9 frames/s 1191667 triangles/sThis data from last week has two important clues answering why some tests were no faster on an 3GHz 8-core machine than on a 1GHz single-core machine. Some of the tests which use OpenGL rendering hovered just under 100 frames per second on both machines. Some of the tests which used software 3D rendering hovered at around 30 frames per second. I'm embarrassed to admit I stared at these clues for several days and followed many false leads before their significance became obvious. Three different throttling mechanisms are at work here.
Many of these tests use the Graphing Calculator animation slider to run through multiple frames. To keep the slider user interface closer to consistent behavior, the slider animation, by default, will step at most 30 values per second so that the rate of the slider does not vary too wildly depending on the complexity of the equation the user types. (The user can disable this throttle by pressing Command-Option-T.) When I wrote the benchmarking code on older slower computers, the benchmark examples were mostly under the 30 steps per second limit. Predictably, computers are much faster today. I classify this problem as a single oversight bug: the slider is now not throttled when the benchmark is running.
Graphing Calculator 1.0 of 1993 used cooperative multi-tasking. A single-thread of execution processed all user events, all drawing, and all computation. To keep the system responsive, computational tasks were done a little bit at a time during what was then known as "idle events" when no user keyboard or mouse events required attention. Though all of the heavy-lifting calculations now run in separate, independent, preemptive threads of their own, a little bit of that legacy "idle event" architecture remains: GC4 uses a periodic system timer to call what was once the GC Idle Event handler every 0.5, 0.01, or 0.001 seconds to see if it is time to advance the animation slider or blink the cursor. How and when it decides on the frequency of that one timer is complicated, and was buggy. That introduced the 100 frame per second upper limit in the benchmark.
The architecture behind how GC is using that one timer is wrong on many levels. Separate tasks should have have separate timers . There is no need to conflate blinking the cursor with polling threaded computations. When there is a highlighted selection rather than a blinking cursor there is no need for that periodic task at all. Polling is a sign indicating poor design. Polling too frequently wastes CPU cycles. Polling infrequently introduces latency. Either way, it is cleaner to have asynchronous jobs send messages when they finish to awaken whatever process is awaiting their results.
Lastly, it never benefits the user when software attempts to update the display faster than the physical display itself can show those updates. A 100 Hz display can physically show no more than 100 different images per second. This limit arises from the physical mechanism of an electron beam scanning right to left, top to bottom, onto the phosphors of a cathode ray tube. Though LCDs do not use this physical mechanism, Mac OS X treats their electronics as a 60 Hz display. Mac OS X implements coalesced updates in the Quartz framework. This blocks any application which tries to update more frequently than sixty times per second, which saves CPU cycles from drawing operations the user could not possibly see anyway. By trying to redraw the Graphing Calculator window too frequently, it was merely stalling waiting for beam synchronization. Typically, GC throttles its drawing itself but the Benchmark disable GC's internal redraw throttle for measurement purposes. I have not yet fully analyzed how coalesced update stalls affect the GC benchmark. Disabling Beam Sync in Quartz Debug speeds up the benchmark measurably, but I need to analyze where the stalls are occurring.
Take home lessons: I frequently have no idea where my own software is spending its time or why. The current set of benchmark tests is far too easy. I need to redesign them to be taxing on newer machines or the measurements will be nearly meaningless. The Mac OS X 10.4 of 2007 is an utterly different beast from the 128K Macs of my youth.
]]>After fixing that, some tests ran twenty times faster. Other tests however, still ran at the same speed as on the older, slower, single-core laptop. I devoted the last two weeks to figuring out why.

Mac OS X provides a suite of visualization and analysis tools to help developers understand their software to get the best performance. I use these so frequently, they occupy a permanent presence on my Mac OS X Dock: Shark, OpenGL Profiler, OpenGL Driver Monitor, Quartz Debug, Thread Viewer, Activity Monitor, and Spin Control. These tools allow programmers to peek under the hood of their applications while they are running, each giving a different perspective on what is going on. Fitting all the sensory overload of data together, determining which parts are significant and interpreting it, however, is another problem altogether.
]]>
Spike returns triumphant from the garden. After inhaling half an avocado, he held on greedily to the rest until he was ready for it. His wet food contains a fair bit of avocado. He seemed quite pleased with himself to discover that food really does fall from trees. I wouldn't let him back in until he finished. Close-up below the fold....
]]> ]]>
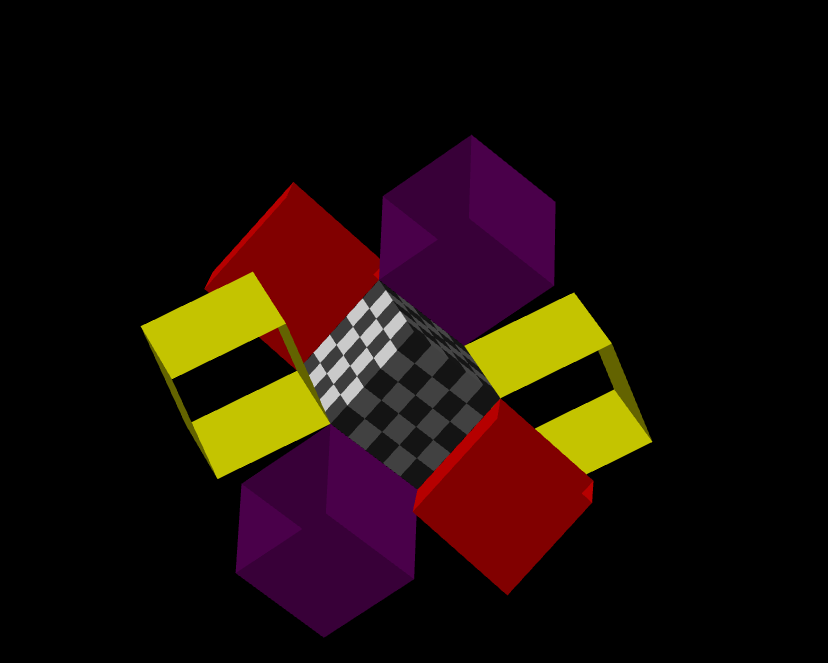
Yesterday was spent debugging until two in the morning trying to diagnose a drawing artifact which occured only on Intel-native builds of GC4 when animating colors on a static 3D model defined using an implicit surface equation using OpenGL vertex buffer objects. The image above started out, correctly, as a solid red sphere. When animating the colors using the GC slider, the top of the sphere did not change, remaining red. The middle of the sphere animated correctly. The bottom of the sphere animated but rgb color values (a,b,c) would display shifted as (b,c,a).
]]> At first I suspected a synchronization bug in the new code which implements the data decomposition breaking apart function evaluation across multiple cores for parallel execution. I did find bugs there, but not this one. Since the problem occurs only on Intel-native builds, I suspected a byte-swapping, or endian error. Reviewing hundreds of lines of code did find a few endian bugs, but again, none related to this problem. A friend with far more OpenGL experience stayed up with me over instant messaging until one in the morning with diagnostic advice to instrument the code looking for hints, and helped me interpret the clues to narrow the search. Eventually we focussed on the one line of code which implements the instruction to update the VBO color data each frame of the animation:glBufferSubData(GL_ARRAY_BUFFER, offset, size, data);
Several hours then ensued verifying that the offset, size, and color data being passed were reasonable and correct, and that the VBO itself was correctly configured. Everything checked out, however, and no further hints presented themself. I knew it was time to go to sleep, when upon googling relevant keywords to see if anyone else out there has encountered similar problems, the number one hit for my search critera was a thread I started in 2004 on the Apple Mac-OpenGL mailing list seeking help to diagnose a different bug involving color arrays in VBOs in precisely these same lines of code when I originally wrote them working on GC 3.5!
As has often been the case, after a long frustrating day of unsuccessful approaches and apparently fruitless investigation, I woke up a few hours later eager to try one more test. I replaced the call to glBufferSubData with a sequence of calls that I would have expected to produce identical results:
 GLubyte* dest = glMapBuffer(GL_ARRAY_BUFFER, GL_WRITE_ONLY);
 dest += colorOffset;

 for (int i = 0; i < fNumVertices; i++) {
   *(ColorArrayElement*)dest = colorArray[i];
   dest += sizeof(ColorArrayElement);
   }

 GLboolean success = glUnmapBuffer(GL_ARRAY_BUFFER);
The code above copies the same buffer to the same place, but does so explicitly by mapping the buffer to memory and copying it an element at a time. It, however, works, eliminating the artifact. The difference may be due to a lack of understanding of the OpenGL API on my part or it may be caused by a bug elsewhere in my code. I know there are still many. It could even be a bug in the OpenGL implemention. I asked the Mac-OpenGL list and a response moments later clarified part of it. (If glBufferSubData operated asynchronously, the behavior might be explained as a synchronization error in GC. However, it is synchronous.)
When I was developing Graphing Calcualtor 3.5 in 2004, it's combined use of vertex buffer obects, full screen anti-aliasing, and GPU fragment programs generated on the fly from equations put me on the bleeding edge of OpenGL new feature adoption. I spent many months debugging to distinguish between GC bugs due to my own carelessness or lack of understanding, OpenGL driver bugs (in Apple's GL software layer), OpenGL driver bugs or hardware bugs in ATI and nVidias hardware and software. While each OpenGL feature on its own generally works as advertised, sometimes combining the newer features in ways that have not been tested can lead to surprising results.
Of all the many e-mail lists to which I subscribe, Mac-OpenGL has, by far, the best signal-to-noise ratio. I'm frequently impressed by the quality, speed, and friendliness of response on deeply technical and tricky issues. Even more amazing, the numerous Apple folks who post there do so on their own time and initiative as a public service to the developer community. Thank you!
]]>